In the UK, anyone who earns more than £12,570 during the 2024/2025 financial year should pay income tax. However, there are some situations where you don’t pay tax, such as earning tax-free interest with a cash ISA or tax-free profits with a stocks and shares ISA.
We look at how many people are paying tax, where the UK’s tax revenue comes from and what the money is spent on.
Tax statistics: Highlights
There are an estimated 37.4 million income taxpayers in 2024/2025, up from 36.2 million in 2023/2024.
In the 2022/23 tax year, the government collected £924 billion in UK taxes, up from £915 billion in 2021/22.
In 2021/22, the average household paid £15,200 in direct taxes each year. This means the average UK resident pays £6,440 in taxes over a year.
Two-fifths of UK tax revenue (39%) is spent on health and welfare, totalling £420 billion.
The top 10% of income taxpayers contribute 60.3% in income tax.
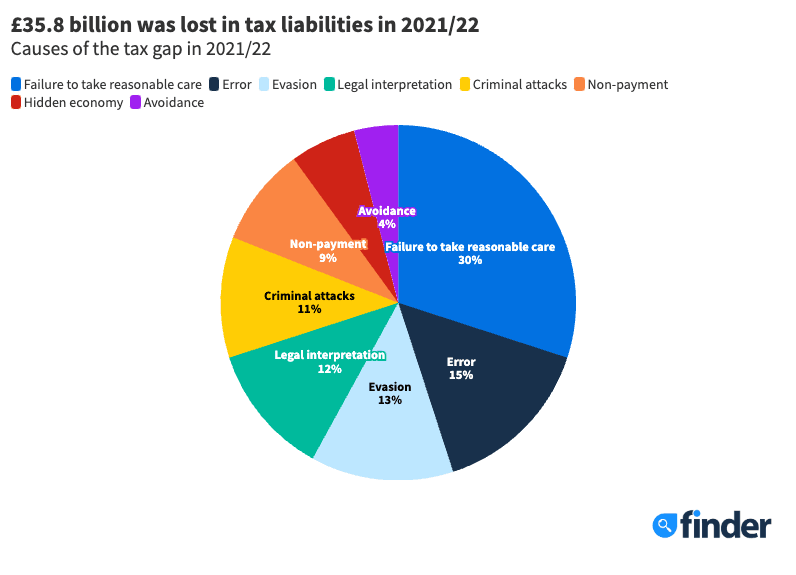
£35.8 billion was lost in taxes due in 2021/22, including £4.7 billion lost to tax evasion.
How many taxpayers are there in the UK?
There are an estimated 37.4 million income taxpayers in 2024/2025, up from 36.2 million in 2023/2024. Most of these are basic rate income taxpayers – earning £50,000 or less – making up 29.5 million taxpayers. There are also 6.31 million higher rate income taxpayers and 1.13 million additional rate income taxpayers.
Basic rate: Annual income of £12,571 to £50,270. You pay income tax of 20%.
Higher rate: Annual income of £50,271 to £125,140. You pay income tax of 40%.
Additional rate: Annual income from £125,141. You pay income tax of 45%.
How much tax does the average person pay?
In 2021/22, the average household paid £15,200 in direct taxes each year, including income tax, national insurance, council tax and other duties. This means the average UK resident paid £6,440 in taxes over the year, based on the fact there are 2.36 people per household.
How much tax does the top 10% pay?
Research has shown that the top 10% of income taxpayers contribute around 60% of income tax. The top 50% of income taxpayers contribute the vast majority of income tax payments (90.5%).
How much does the UK government get from taxes?
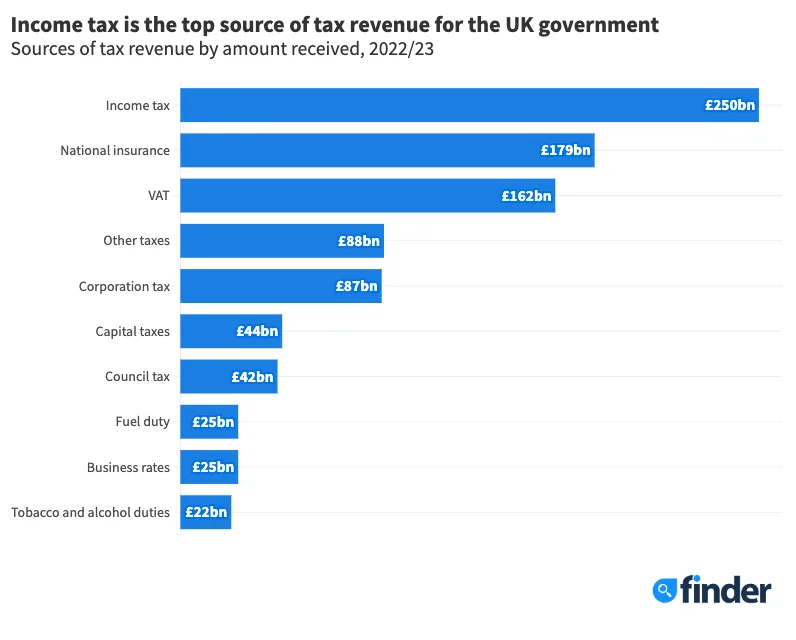
In the 2022/23 tax year, the government collected £924 billion in UK taxes. This is a 1% increase from the 2021/22 tax year when the government collected £915 billion in taxes.
The main components of tax revenue are income tax (27%) and national insurance (19%), totalling nearly half of the tax collected by the UK government. The remaining half is received from VAT (18%), corporation tax (9%), capital taxes (5%), council tax (5%), business rates (3%), fuel duty (3%), tobacco and alcohol duty (2%) and other taxes (10%).
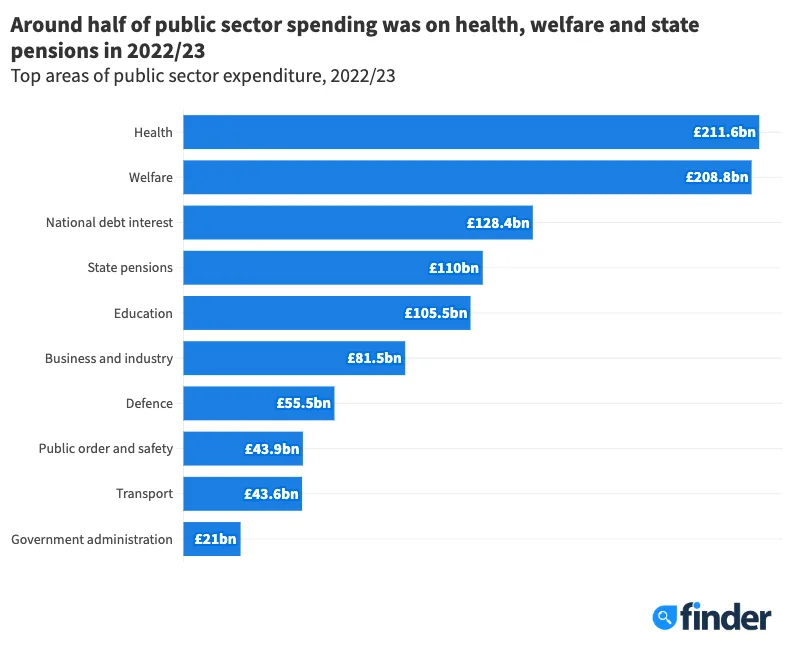
The UK government had a total public sector expenditure of £1.16 trillion in 2022/23, £131 billion more than they received in receipts.
The majority of public spending by the UK government goes on public health (£211.6 billion) and welfare (£208.8 billion). A significant portion also goes on interest payments for national debt (£128.4 billion), state pensions (£110 billion) and education (£105.5 billion).
Overall, around half of UK public spending is on health, welfare and state pensions, with a combined total of 49.7%, meaning much of taxpayer money goes to these areas. However, 12% is also spent on debt interest payments.
Most people in the UK get a personal allowance, which is £12,570 for 2023/2024. You are not taxed on any income up to this amount.
There are also various circumstances where Brits aren’t expected to pay any tax at all:
If you receive income from a small business, the first £1,000 of income you earn is called a “trading allowance” and is tax-free.
Similarly, the first £1,000 you make from subletting your property is tax-free.
If you’re subletting a room using the Rent a Room Scheme, you don’t need to pay tax on the money earned from your lodger, up to a total of £7,500 per year.
Profits made from ISA accounts are not taxed.
Dividends from companies you’ve invested in are tax-free up to £1,000.
State benefits like the housing benefit, income support and the disability living allowance aren’t taxed.
Premium bonds and National Lottery winnings are also not taxed.
Tax evasion statistics and the tax gap
In 2021/2022, the tax gap is estimated to be 4.8% of the total tax due, which equates to £35.8 billion in unpaid tax. The largest share of this tax gap is a result of “failure to take reasonable care”, making up 30% or around £10.7 billion. Other top reasons for missing taxes include error (£5.4 billion) and tax evasion (£4.7 billion).
Looking for a current account that does more than just store your money? Club Lloyds’ Current Account is designed to reward you with lifestyle perks, a linked fixed 6.25% AER savings account’, and smart everyday banking tools. (Paid content)
In amongst the festive chaos, Christmas can be a great time to teach the joy of gifting to your kids. We partnered with GoHenry for a Christmas shopping showdown. (Paid content)
The message from kids is clear – they want money lessons, and they want them now. This research reveals how parents are stepping in to fill the gap. (Paid content)
We’ve teamed up with GoHenry to bring you an essential guide to money smarts and how your child can master the real-life skills of earning, saving, spending and investing. (Paid content)
Sophie Barber is a senior content marketing manager for Finder in the UK. She has over 5 years experience in writing and publishing clear, concise and informative articles that help consumers make informed decisions.
See full bio
Sophie's expertise
Sophie
has written
97
Finder guides across topics including:
Looking to invest in an ISA and not sure of the difference? Read our guide as we look at the pros and cons of each and how to invest.
Advertiser disclosure
Finder.com is an independent comparison platform and information service that aims to provide you with the tools you need to make better decisions. While we are independent, the offers that appear on this site are from companies from which Finder receives compensation. We may receive compensation from our partners for placement of their products or services. We may also receive compensation if you click on certain links posted on our site. While compensation arrangements may affect the order, position or placement of product information, it doesn't influence our assessment of those products. Please don't interpret the order in which products appear on our Site as any endorsement or recommendation from us. Finder compares a wide range of products, providers and services but we don't provide information on all available products, providers or services. Please appreciate that there may be other options available to you than the products, providers or services covered by our service.
We update our data regularly, but information can change between updates. Confirm details with the provider you're interested in before making a decision.
How likely would you be to recommend Finder to a friend or colleague?
0
1
2
3
4
5
6
7
8
9
10
Very UnlikelyExtremely Likely
Required
Thank you for your feedback.
Our goal is to create the best possible product, and your thoughts, ideas and suggestions play a major role in helping us identify opportunities to improve.